Buffalo City
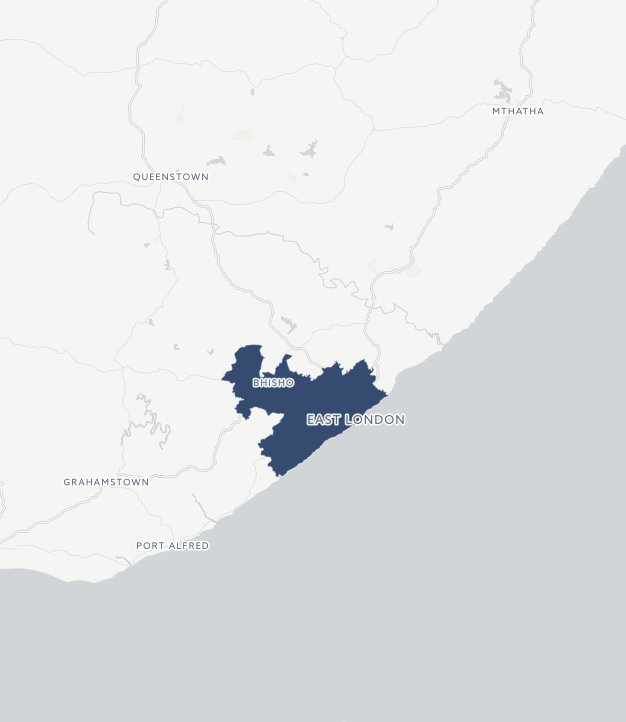
In Buffalo City metro, 25% of the metro's population live in 156 informal settlements and backyards. These settlements make up 40% of the total households living in informal settlements in the Eastern Cape. In 2014, the metro adopted the Integrated Sustainable Human Settlement Plan (ISHSP) which aims to incrementally upgrade informal settlements in-situ and provide serviced sites. The metro aims to upgrade 18,980 households to UISP Phase 2 standards by 2019, in line with the MTSF. The Metro delivered 600 sites in 2019/2020 but it is unclear whether they reached the MTSF target. Approximately 28,000 households live in backyarder shacks, and there is no explicit mention of a dedicated backyarder policy in municipal documentation.
The Metro has a land release strategy and a Land Acquisition and Development Programme supported by the HDA. While the population growth rate was 0.7% per annum between 2001 and 2011, households in informal settlements have been growing at 1.5% per annum. In 2019/2020, Buffalo City has prioritised between 60 and 67 upgrading projects located in the urban network, which indicates the extent of planning for spatial integration.
Policies and programmes for upgrading are outlined in the metros Informal Settlements Upgrading Plan and Strategy, approved in 2015. Under the policy, the metro aims to upgrade all existing informal settlement by the year 2035. The strategies outlined in the document take their prerogative from the strategic planning process of the 10 year Integrated Sustainable Human Settlement Plan (ISHSP), published in 2014. The nature of the upgrading strategy is incremental upgrading for 10% of settlements, basic services for 50% and relocation for 40%. Between 30 and 35% of the capital budget are reserved for Human Settlements and Water and Sanitation respectively for the next three years.
Viewing results for: 2024/2025
2017/2018 2018/2019 2019/2020 2020/2021 2021/2022 2022/2023 2023/2024Progress Breakdown
A Closer Look
Buffalo City
| Gini Co-efficient (2013) | 0.64 |
| Population (2011) | 755200 |
| Pop Growth Rate(2011) | 0.7% |
| % of Municipal Population (2013) | 32.92% |
| No of Households (2013) | 223568 |
| Average Household Size (2016) | 3.4 |
| No of People Below Poverty Line (2013) | 248630 |
| Cost of Living (2014) | 110.2 |
| Female Headed Households | 45.8% |
| Dependancy Ratio (2011) | 47.9 |
| Employment Absorption Rate (2011) | 1.79% |
Cape Town
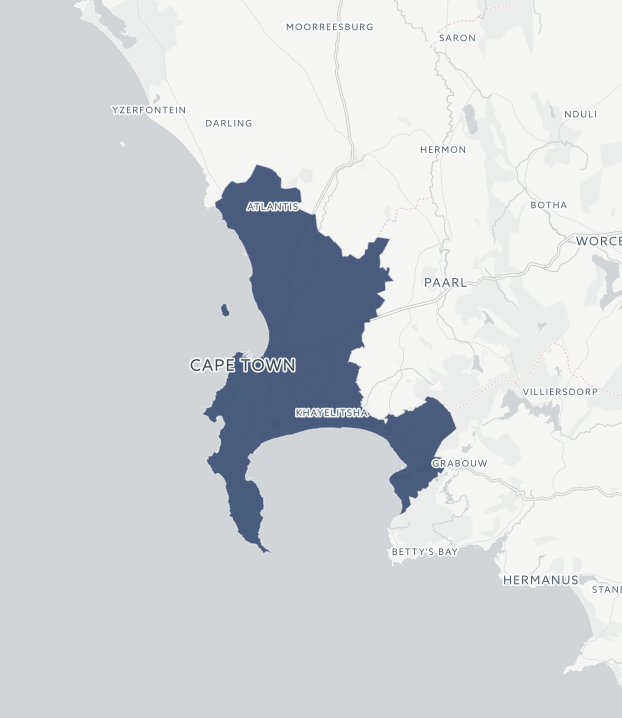
437 informal settlements across Cape Town are some of the most densely populated areas in the city at average of 180 dwelling units per hectare (du/ha), reaching up to 480 du/ha in some cases. Close to 572,000 people live in informal settlements and backyard shacks. In 2011 it was reported that 75% and 72% of Western Cape informal settlement and backyarder households respectively are located in Cape Town. The City has adopted a preventative approach to the growth of informal settlements. The Backyard Improvement Programme which started in 2011 and serviced the city’s rental stock came to a halt in 2018 due to a number of delivery challenges.
In 2014 the Metro revised its existing informal settlement plan which is called the Integrated Human Settlements Framework 2015 - 2019. This strategy outlines the initiatives to shift from providing housing from an ever expanding 'waiting list' towards incremental upgrading. Land planning and acquisition strategy is in place. The strategy has a timeline towards 2032, in which R100 billion (R5bn per annum) will be spent on human settlements in a ratio of 45:45:10 between government, community and private sector.
In 2019/2020, the City of Cape Town planned to develop 1,767 serviced sites. At this rate of delivery, it will take 10 years to service the 57,050 households designated as qualifying for in-situ upgrading. 13% and 37% of the capital budget is reserved for human settlements and water and sanitation (city-wide) provision respectively. The Land Planning and Acquisition programme prioritises forward planning for human settlement development. Nearly 50% of all informal settlements are located on privately-owned land, which impedes effective service delivery and long term consolidation.
Viewing results for: 2024/2025
2017/2018 2018/2019 2019/2020 2020/2021 2021/2022 2022/2023 2023/2024Progress Breakdown
A Closer Look
Cape Town
| Gini Co-efficient (2013) | 0.61 |
| Population (2011) | 3740026 |
| Pop Growth Rate(2011) | 2.6% |
| % of Municipal Population (2013) | 21.62% |
| No of Households (2013) | 1068573 |
| Average Household Size (2016) | 3.3 |
| No of People Below Poverty Line (2013) | 808491 |
| Cost of Living (2014) | 109 |
| Female Headed Households | 38.2% |
| Dependancy Ratio (2011) | 43.6 |
| Employment Absorption Rate (2011) | 1.53% |
Ekurhuleni
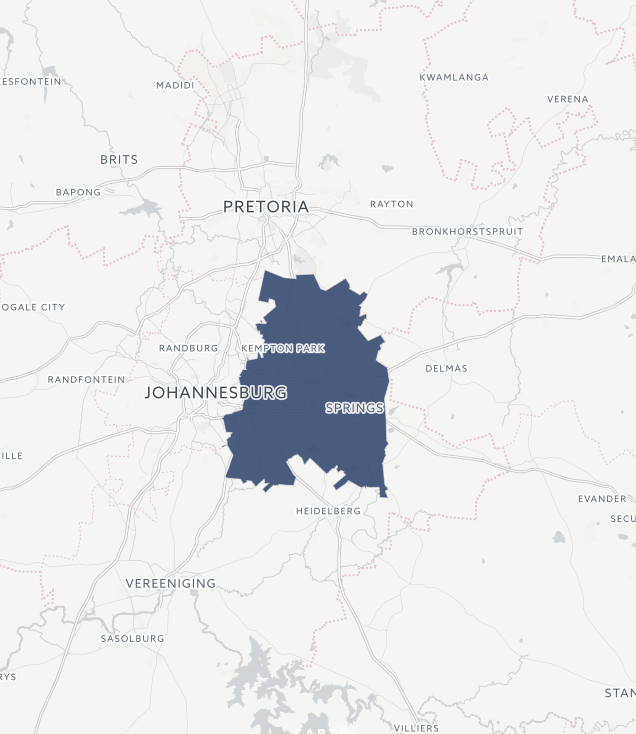
Ekurhuleni, a city of 3.1 million, faces a significant housing crisis. It is estimated that the housing backlog is 450,000, which can be disaggregated as follows: informal settlements (35%), backyarders (45%), waiting list (10%) and overcrowded hostels (10%). 119 informal settlements have been identified, and the city has adopted an Informal Settlement Upgrading Policy/Strategy focused on incremental upgrading and the provision of serviced sites.
Municipal targets for capital expenditure are projected to decrease by 9% pa (38 000 households). This means that with the ISUPG, R11000 per household has theoretically been allocated for upgrading. Between 2001 and 2011, approximately 24 990 housing units were delivered. At this pace of delivery, it will take 210 years to eradicate the housing backlog, ignoring population growth.
The City is in the process of developing a Backyarder Support Plan aimed at supporting 10,000 landlords to upgrade small scale rental accommodation. With regard to informal settlement upgrading, municipal documentation expresses a commitment to incremental upgrading, and has launched a special initiative called Community Builder Programme (CBP) which aims to build the capacity of contractors in self-build housing programmes. At the same time, the city has appointed a service provider under the Management/ Prevention of Illegal Occupation programme to patrol informal settlements and prevent further occupation.
Viewing results for: 2024/2025
2017/2018 2018/2019 2019/2020 2020/2021 2021/2022 2022/2023 2023/2024Progress Breakdown
A Closer Look
Ekurhuleni
| Gini Co-efficient (2013) | 0.65 |
| Population (2011) | 3178470 |
| Pop Growth Rate(2011) | 2.5% |
| % of Municipal Population (2013) | 25.23% |
| No of Households (2013) | 1015465 |
| Average Household Size (2016) | 2.6 |
| No of People Below Poverty Line (2013) | 802026 |
| Cost of Living (2014) | 109 |
| Female Headed Households | 31.3% |
| Dependancy Ratio (2011) | 39 |
| Employment Absorption Rate (2011) | 1.44% |
Ethekwini
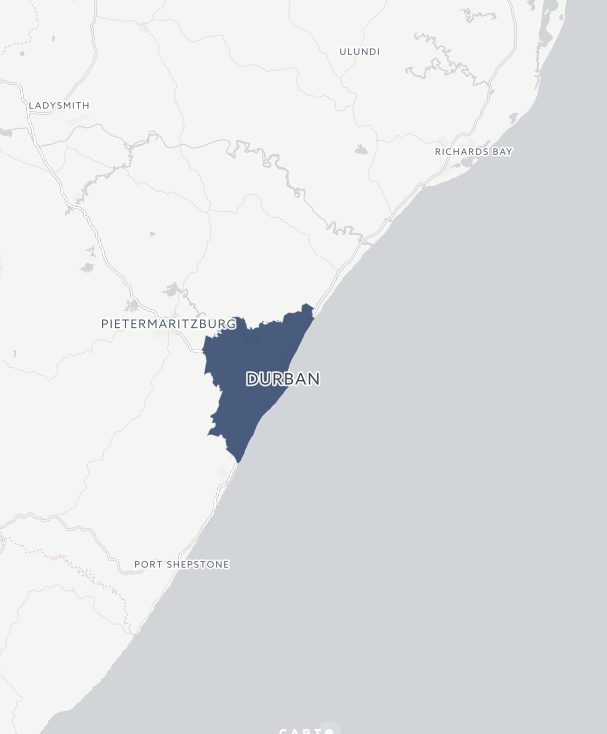
There are over 550 recognized informal settlements in the eThekwini Municipality. Approximately 226 000 households in the metro live in informal settlements, and 49 000 in backyard shacks. A housing backlog of 380 571 units have been identified, and at the current rate of delivery (4 000 – 6 000 units per annum) it will take approximately 80 years to eradicate the housing backlog.
While a backyarder support programme is not established, the Metro is making attempts to better understand the housing option through a small scale data collection project.
Serviced sites are the preferred method of delivering services and upgrade ng informal settlements. The metro's target for delivering sites to UISP Phase 2 and 3 standards by 2019 is 57,000 sites, and it delivered 2 900 in 2019/2020. The metro has adopted the Municipal Land Invasion Policy as a means of controlling land invasions, and has set a performance indicator of stopping 75% of land invasions. Of the capital budget received in 2019/2020, only 5,3% was allocated for upgrading via the ISUPG.
The Metro has a number of partnerships in place with organizations that can facilitate community participation. The iQhaza Lethu program is a notable upgrading partnership between the Metro, the European Union, the Project Preparation Trust of South Africa, and community-based partners. The program is currently piloting a collaborative approach to upgrading projects in 8 settlements across Ethekwini Municipality.
Viewing results for: 2024/2025
2017/2018 2018/2019 2019/2020 2020/2021 2021/2022 2022/2023 2023/2024Progress Breakdown
A Closer Look
Ethekwini
| Gini Co-efficient (2013) | 0.63 |
| Population (2011) | 3442361 |
| Pop Growth Rate(2011) | 1% |
| % of Municipal Population (2013) | 31.61% |
| No of Households (2013) | 956713 |
| Average Household Size (2016) | 3.3 |
| No of People Below Poverty Line (2013) | 1087981 |
| Cost of Living (2014) | 110 |
| Female Headed Households | 40% |
| Dependancy Ratio (2011) | 42.8 |
| Employment Absorption Rate (2011) | 1.69% |
Johannesburg
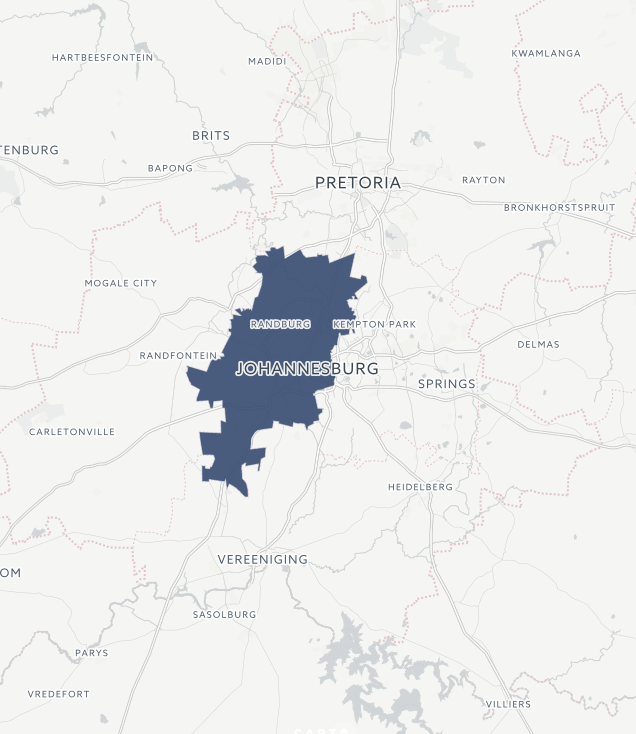
The City's Sustainable Human Settlement Urbanisation Plan adopted in 2012 seeks to address the short, medium and long term needs of 252 identified informal settlements. 296 000 households live in these informal conditions, which is approximately 17% of the municipal population. The estimated housing demand is at 300 000 households.
The City of Joburg's Formalization and Regularization of Informal Settlements Programme initiated in 2011 works toward the incremental upgrading of informal settlements. Of the 252 informal settlements, the city reports to have fully upgraded 17% of identified settlements. The remaining 181 are categorised and planned for as follows: full upgrade and interim services (69%), and relocations (15%). R365 million will be spent on informal settlements, which is a capital expenditure portion of 6% in the 2019/2020 financial year.
In municipal documentation there is no mention of a dedicated programme to improve backyard shacks, but strong support for incremental densification is expressed. The City recognizes the value of the backyard rental market for income generation and affordable shelter, however, further support for inadequate service standards is still required.
Viewing results for: 2024/2025
2017/2018 2018/2019 2019/2020 2020/2021 2021/2022 2022/2023 2023/2024Progress Breakdown
A Closer Look
Johannesburg
| Gini Co-efficient (2013) | 0.65 |
| Population (2011) | 4434827 |
| Pop Growth Rate(2011) | 3.2% |
| % of Municipal Population (2013) | 24.53% |
| No of Households (2013) | 1434856 |
| Average Household Size (2016) | 2.7 |
| No of People Below Poverty Line (2013) | 1087963 |
| Cost of Living (2014) | 108 |
| Female Headed Households | 36.2% |
| Dependancy Ratio (2011) | 37.6 |
| Employment Absorption Rate (2011) | 1.42% |
Mangaung
In Mangaung, it is reported that 29 035 households reside in 34 identified informal settlements. Census data shows that in 2011, approximately 11% of the city’s population lived in informal settlements and another 4% of the population live in backyarder shacks. To date, all identified informal settlements within the Metro have access to electricity, waste removal services, and are at different land development processes. In 2018/2019 financial year, the Metro budgeted a total of R228 million to implement phase 3 of the Informal Settlement Upgrading Programme i.e. provision basic services (individual water and sewer connections) to 14 informal settlements comprising of about 3204 households
A change is strategy was announced with the Informal Settlements Upgrading Strategy (ISUS), adopted by council in 2012. The strategy seeks to incrementally upgrade informal settlements. On the other hand, the Informal Settlements Resettlement Plan (ISRP) is an attempt to prevent further proliferation of the informal settlements which is a combination of forward planning and regulation and enforcement. Upgrading is a component of this strategy, which relies on land development processes and integrated resource planning. 20% of the USDG is ring-fenced for the upgrading informal settlements. No explicit mention of a backyarder programme is mentioned in municipal documentation.
In keeping with the council's housing strategy, an ambitious land release programme is regarded by the council as the largest and boldest land development programme in the province since 1994. The programme will ensure the release of more than 30 000 hectares of land, creating more than 45 000 employment opportunities. The strategy relies on long and medium term goals. In the long term, 10 land parcels have been acquired for mixed development in the GAP market which will yield a total of 13 000 housing opportunities at an average density of 12,5 units per hectare. In the medium term, land for economic investment and land for servitudes and amenities are planned.
Viewing results for: 2024/2025
2017/2018 2018/2019 2019/2020 2020/2021 2021/2022 2022/2023 2023/2024Progress Breakdown
A Closer Look
Mangaung

| Gini Co-efficient (2013) | 0.62 |
| Population (2011) | 747431 |
| Pop Growth Rate(2011) | 1.5% |
| % of Municipal Population (2013) | 28.27% |
| No of Households (2013) | 231921 |
| Average Household Size (2016) | 3 |
| No of People Below Poverty Line (2013) | 211303 |
| Cost of Living (2014) | 110 |
| Female Headed Households | 40.8% |
| Dependancy Ratio (2011) | 47.4 |
| Employment Absorption Rate (2011) | 1.73% |
Nelson Mandela Bay Metro
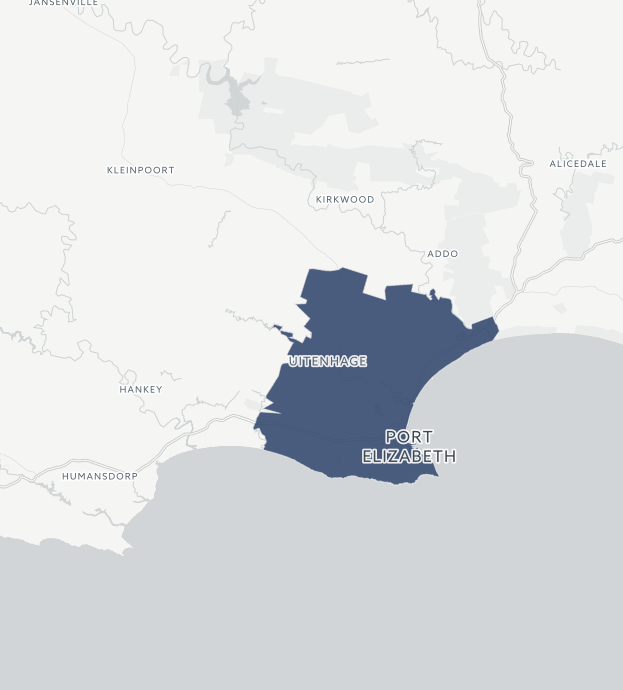
Close to 110 550 people in Nelson Mandela Bay Metro live in informal settlements and backyard shacks. The Municipality has a programme dedicated to the upgrading of informal settlements, as contained in the Informal Settlements Upgrading Plan (adopted in 2008). In 2008, 81 informal settlements were identified, which has subsequently grown to 105 settlements.
The Metro's assessment and categorisation of informal settlements suggests that 53% of settlements can be fully upgraded to township status, 37% can receive interim to full services, and 10% will need to be relocated. There is no mention of a backyarder support plan in municipal documentation. In line with the MSTF national commitment to upgrade 750,000 informal households to UISP Phase 2 and 3 standards by 2019, NMBM has a goal of servicing 2,900 sites per annum. In 2016/17, it has set a goal of 4 000 sites. The capital budget is also in line with the target, with 21% dedicated to informal settlement upgrading.
The Metro has a draft Land Release Strategy which is undergoing a prolonged approval process. This strategy seeks to release land in accordance with the Metro Spatial Development Framework to ensure minimal expenditure on bulk services and maximum allocation for housing and informal settlement upgrading, or for relocations.
Viewing results for: 2024/2025
2017/2018 2018/2019 2019/2020 2020/2021 2021/2022 2022/2023 2023/2024Progress Breakdown
A Closer Look
Nelson Mandela Bay Metro
| Gini Co-efficient (2013) | 0.63 |
| Population (2011) | 1152116 |
| Pop Growth Rate(2011) | 1.4% |
| % of Municipal Population (2013) | 30.34% |
| No of Households (2013) | 324292 |
| Average Household Size (2016) | 3.4 |
| No of People Below Poverty Line (2013) | 349580 |
| Cost of Living (2014) | 109 |
| Female Headed Households | 40.6% |
| Dependancy Ratio (2011) | 46 |
| Employment Absorption Rate (2011) | 1.73% |
Tshwane
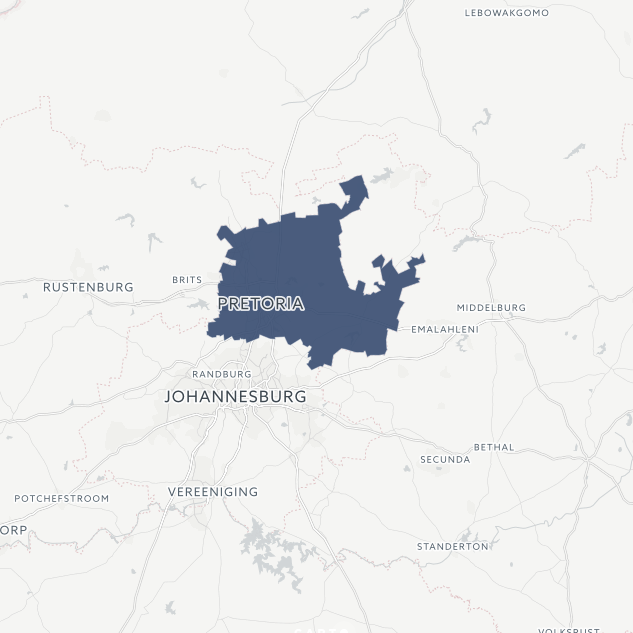
In the City of Tshwane there are an estimated 186 informal settlements, in which 219 934 people reside. 36% of the identified and assessed settlements have been upgraded and the remaining are categorised as follows: 8% full upgrade, 42% interim services, and 13% relocations. The proliferation of backyard shacks has escalated in recent years, and records reflect that there are 83 378 households living in backyard dwellings. With a housing backlog of 202 312 households, the City of Tshwane is in the process of developing a city-wide informal settlement upgrading strategy. Tshwane trails only Cape Town (9%) as having the highest growth rate of in backyard shacks in cities during this period. Surprisingly, there is no mention of a backyarder support programme in the council's core municipal documentation.
It appears that the city council is shifting budgets to address living conditions in informal settlements and backyards. In the context of expressed funding constraints, the City has reserved 15% of its capital expenditure budget for upgrading projects.
The council is in the process of developing a Land Release Strategy. This strategy appears to have dual functions: Firstly, it seeks to create mechanisms for releasing land for housing, and secondly, the strategy will deal with illegal occupation of Council owned land and buildings.
Viewing results for: 2024/2025
2017/2018 2018/2019 2019/2020 2020/2021 2021/2022 2022/2023 2023/2024Progress Breakdown
A Closer Look
Tshwane
| Gini Co-efficient (2013) | 0.63 |
| Population (2011) | 2921488 |
| Pop Growth Rate(2011) | 3.1% |
| % of Municipal Population (2013) | 23.38% |
| No of Households (2013) | 911536 |
| Average Household Size (2016) | 2.9 |
| No of People Below Poverty Line (2013) | 683097 |
| Cost of Living (2014) | 110 |
| Female Headed Households | 35.8% |
| Dependancy Ratio (2011) | 39 |
| Employment Absorption Rate (2011) | 1.48% |
